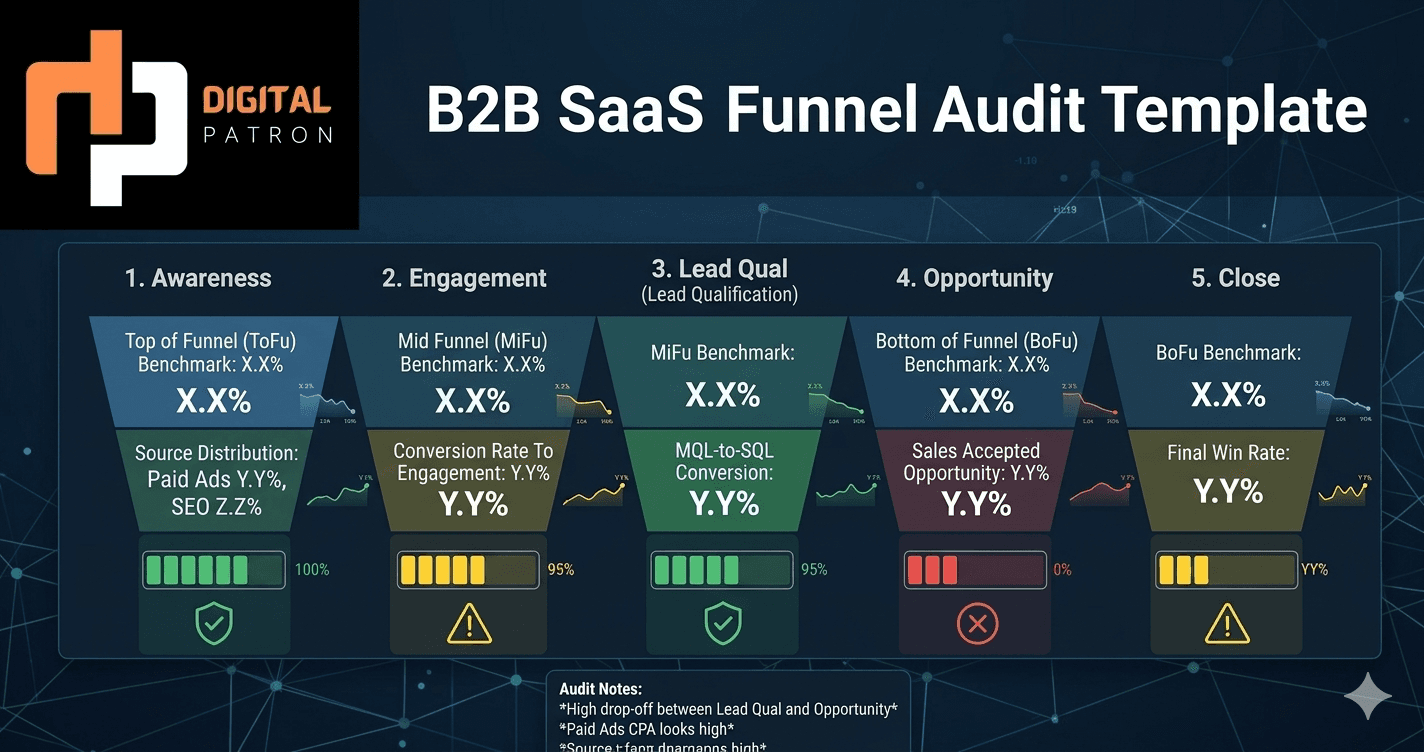
B2B SaaS Marketing Funnel Audit: The 2026 Template
Why funnel audits matter (and why most companies do them wrong)
A working SaaS funnel has predictable conversion rates at each stage. Company A gets 1,000 website visitors → 40 SQLs (4% conv rate) → 10 opps (25% conv rate) → 3 deals (30% close rate). Every month, same ratios. They can predict: "If I invest ₹5L in demand gen, I'll get ₹75L in pipeline within 3 months."
Company B also gets 1,000 website visitors, but the conversion rates are leaky: 30 SQLs (3%), 5 opps (16%), 1 deal (20%). They can't forecast. They dump ₹5L into marketing and get ₹25L in pipeline. The marketing team looks broken, sales blames the leads, and nobody has visibility into where the leak is.
Below is the audit template. Use it quarterly to diagnose which stage is broken.
Stage 1: Awareness (Website Traffic)
What to measure:
- Monthly website visitors (Google Analytics 4)
- Traffic by channel (organic, paid, referral, direct, email, other)
- Organic traffic growth MoM (should be +5–15% for growing SaaS)
- Traffic quality score (% of visitors from ICP vs. non-ICP) — use UTM parameters + Clearbit to identify
Benchmarks:
- Early-stage SaaS (Series A, <₹5Cr ARR): 3K–8K visitors/month, 40–60% organic
- Growth-stage SaaS (Series B, ₹5Cr–₹25Cr ARR): 15K–40K visitors/month, 50–70% organic
- Mature SaaS (Series C+, >₹25Cr ARR): 50K–200K+ visitors/month, 70%+ organic
Red flags:
- Organic traffic flat for 3+ months (content strategy or backlink building is broken)
- Organic traffic declining YoY (lost rankings, algorithm hit, or competitor took share)
- >50% of traffic from PPC campaigns (too reliant on paid; organic motion is weak)
- Low time-on-site (<2 minutes) or high bounce rate (>65%) — content isn't resonating
Stage 2: Engagement (Landing Page to Lead Capture)
What to measure:
- Form submission rate (% of landing page visitors who submit a form / download resource / request demo)
- Click-through rate on CTAs (% of page visitors who click "Book Demo" or "Download" button)
- Landing page conversion rate (form submissions / landing page visitors)
- Engagement by traffic source (which channels convert best?)
Benchmarks:
- Homepage conversion rate: 2–5% (very top-of-funnel traffic)
- Dedicated product landing page: 8–15% (more qualified traffic)
- Case study page: 12–20% (high-intent traffic)
- Free tool / resource page: 15–30% (engagement-first content)
Red flags:
- Landing page conversion <2% (messaging mismatch, page design, or wrong ICP being driven)
- Form abandonment >80% (form is too long or asking wrong questions)
- CTA click rate <5% (button placement or copy is weak)
Stage 3: Lead Qualification (Lead to SQL)
What to measure:
- SQL conversion rate (% of leads that meet SQL criteria)
- Lead response time (how fast does sales call/email a new lead? Should be <2 hours for best results)
- Lead quality score (% of SQLs that actually have budget, authority, need)
- Sales reps' opinion of lead quality (are they actually following up?)
Benchmarks:
- Organic leads → SQL conversion: 8–18% (higher quality)
- PPC leads → SQL conversion: 4–10% (lower quality)
- Referral leads → SQL conversion: 25–40% (highest quality)
Red flags:
- Lead-to-SQL conversion <5% (either poor lead quality or weak qualification process)
- Sales reps not following up leads within 2 hours (process broken; leads will go cold)
- Huge gap between marketing's SQL count and sales' working pipeline (marketing inflating numbers or sales rejecting "bad" leads)
Stage 4: Opportunity (SQL to Active Pipeline)
What to measure:
- SQL-to-opportunity conversion rate (% of SQLs that move into CRM as active opps)
- Sales cycle length (days from SQL to opportunity)
- Demo attendance rate (% of demos booked that actually happen)
- Deal size distribution (are you getting the ACV you expected?)
Benchmarks:
- SQL to opp conversion: 15–35% (many SQLs need more nurturing before they're ready)
- Average sales cycle: 14–45 days for SMB, 45–90 days for mid-market
- Demo attendance: 70–85% (well-qualified meetings, well-communicated)
Red flags:
- SQL-to-opp conversion <10% (reps aren't doing discovery, or leads are too early-stage)
- Demo attendance <60% (either bad qualification or logistical friction)
- Sales cycle >120 days for mid-market SaaS (either too complex, wrong ICP, or deal is stalling)
Stage 5: Close (Opportunity to Customer)
What to measure:
- Opportunity-to-close conversion rate (% of opps that close)
- Average sales cycle from opp to close
- Deal size (average, median, max)
- Win rate by rep, by ICP segment, by product tier
Benchmarks:
- Opp-to-close rate: 15–35% (highly variable by ICP and ACV)
- Average close rate: 20–28% (across 3+ month sales cycles)
Red flags:
- Close rate <15% (either weak discovery, wrong ICP, or overpricing)
- Huge variance in rep close rates (best rep 40%, worst rep 10%) — training or ICP clarity is broken
- Slipping deal size (average ACV declining month-over-month) — either discounting or wrong ICP
End-to-end funnel: where are you leaking?
Let's say you have:
- 10K visitors/month
- 2% engagement (200 leads)
- 8% lead-to-SQL (16 SQLs)
- 25% SQL-to-opp (4 opps)
- 25% opp-to-close (1 closed deal)
Your end-to-end conversion: 10K visitors → 1 customer = 0.01% conversion.
Most founders blame "bad leads" (stage 2) or "weak sales team" (stage 4). But the data might show:
- Stage 1 is fine (10K visitors is enough)
- Stage 2 leaks 98% (200 leads from 10K is actually 2% — below benchmark of 5–8%)
- Stage 3 is fine (16 SQLs from 200 is 8%, on-target)
- Stage 4 is weak (4 opps from 16 SQLs is 25%, should be 30%+)
- Stage 5 is weak (1 deal from 4 opps is 25%, should be 30%+)
The fix: improve Stage 2 landing pages (5% → 8% conversion = 120 leads instead of 200). That alone moves the funnel from 1 deal to 2 deals (100% revenue increase) with zero additional traffic investment.
The audit checklist (do this quarterly)
- ☐ Google Analytics 4 configured correctly (event tracking for all CTAs)
- ☐ Website traffic trend: Is organic growing 5–15% MoM?
- ☐ Landing page conversion rate: Is it 5%+ for key landing pages?
- ☐ Lead-to-SQL conversion: Is sales actually calling/emailing leads within 2 hours?
- ☐ SQL-to-opp conversion: Are reps moving >20% of SQLs into pipeline?
- ☐ Opp-to-close: Are you closing >20% of opps?
- ☐ Identify biggest leak: where is >40% of potential revenue getting lost?
- ☐ Create fix: assign owner and 30-day target improvement
Want a full funnel audit? Book a 45-min funnel deep-dive. We'll analyze your entire pipeline (traffic, leads, opps, closes) and identify the single stage where a 5–10% improvement would double your revenue.